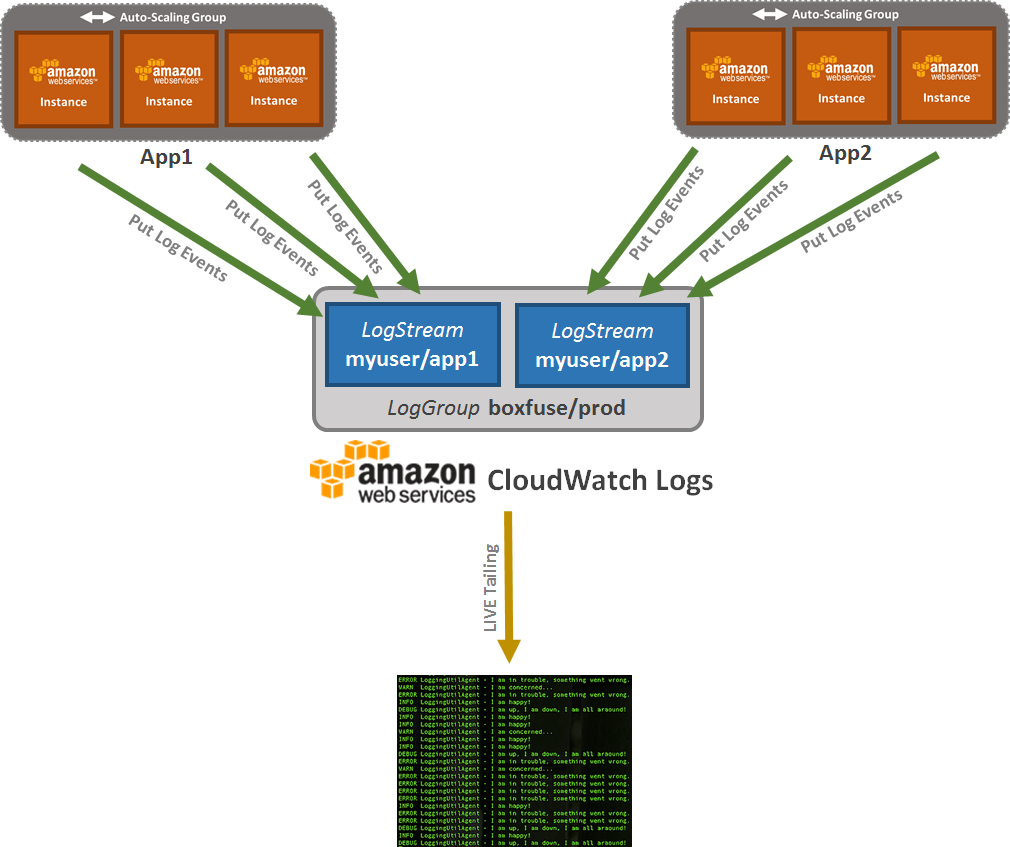
One of the most important diagnostic tools available to us for locating problems with our apps is logging. Logging has historically involved writing text lines to a local filesystem file. This leads to a number of problems. In addition, it is now necessary to search through multiple backend servers to determine which one handled the request we were trying to find. Naturally, it should be noted that different backend instances may receive requests from the same session. The fact that any persistent data on an instance in a cloud environment expires along with the instance itself is even more serious. Furthermore, we no longer have active control over when certain instances are terminated in the case of auto-scaling. We must examine centralized logging as a novel answer for this. A central service receives all logs, aggregates them, stores them, and makes them searchable. For this, AWS provides a feature known as CloudWatch Logs.

The images of those applications automatically reroute both stdout and stderr to the application’s CloudWatch Logs LogStream within the CloudWatch Logs LogGroup for the current environment using the open-source CloudCaptain CloudWatch Logs agent.

Providing a brand-new open-source appender for both Logback and Log4J, is one step further today for JVM apps. By natively integrating with the chosen logging framework and having the choice on how to route the logs, this provides a far more fine-grained control.
Installation
Simply include the dependency in your build file to incorporate the CloudCaptain Java log appender for AWS CloudWatch Logs into your application.
Maven
Start by adding the CloudCaptain Maven repository to your list of repositories in your pom.xml:
<repositories>
    <repository>
        <id>central</id>
        <url>https://repo1.maven.org/maven2/</url>
    </repository>
    <repository>
        <id>boxfuse-repo</id>
        <url>https://files.cloudcaptain.sh</url>
    </repository>
</repositories>
Then add the dependency:
<dependency>
    <groupId>com.boxfuse.cloudwatchlogs</groupId>
    <artifactId>cloudwatchlogs-java-appender</artifactId>
    <version>1.0.2.17</version>
</dependency>
Gradle
Start by adding the CloudCaptain Maven repository to your list of repositories in your build.gradle:
repositories {
    mavenCentral()
    maven {
        url "https://files.cloudcaptain.sh"
    }
}
Then add the dependency:
dependencies {
    compile 'com.boxfuse.cloudwatchlogs:cloudwatchlogs-java-appender:1.0.2.17'
}
Usage
To use the appender you must add it to the configuration of your logging system.
Logback
Add the appender to your logback.xml file at the root of your classpath. In a Maven or Gradle project you can find it under src/main/resources:
<configuration>
    <appender name="CloudCaptain-CloudwatchLogs" class="com.boxfuse.cloudwatchlogs.logback.CloudwatchLogsLogbackAppender"/>

    <root level="debug">
        <appender-ref ref="CloudCaptain-CloudwatchLogs" />
    </root>
</configuration>
Log4J2
Add the appender to your log4j2.xml file at the root of your classpath. In a Maven or Gradle project you can find it under src/main/resources:
<?xml version="1.0" encoding="UTF-8"?>
    <Configuration packages="com.boxfuse.cloudwatchlogs.log4j2">
    <Appenders>
        <CloudCaptain-CloudwatchLogs/>
    </Appenders>
    <Loggers>
        <Root level="debug">
            <AppenderRef ref="CloudCaptain-CloudwatchLogs"/>
        </Root>
    </Loggers>
</Configuration>
Code
And that’s all the setup you need! With SLF4J or your preferred api, you can now begin using it from code as you typically would.
Logging a message like this:
private static final Logger LOGGER = LoggerFactory.getLogger(MyClazz.class);
...
LOGGER.info("This is a log message ...");
will now be automatically sent as a structured JSON document to CloudWatch Logs. Important metadata is also automatically added to the document by the CloudCaptain CloudWatch Logs appender, making it appear as follows:
{
    "image": "myuser/myapp:123",
    "instance": "i-607b5ddc",
    "level": "INFO",
    "logger": "org.mycompany.myapp.MyClazz",
    "message": "This is a log message ...",
    "thread": "main"
}
This is very useful as this will allow us to query and filter the logs later.
Keep in mind that these are only the automatically sent properties. you can also utilize the MDC to fill in a lot of additional ones (such current user, session id, request id, etc.).
Displaying the Logs
To display the logs simply open a new terminal and show the logs for your app in your desired environment:
> boxfuse logs myapp -env=prod
Live tailing
And if you want to follow along in real time you can use log tailing:
> boxfuse logs myapp -env=prod -logs.tailAnd new logs will now automatically be displayed as soon as they are sent from the application to CloudWatch Logs.
Log filtering
But this can yield a lot of results. CloudCaptain also offers robust log filtering to help discover the needle in the haystack, both on old logs and when a log stream is being tailed live.
The structured logs’ properties can be used to precisely filter them as you see fit. For instance, you can only display the logs for a particular instance and tail the logs live on the production environment on AWS by doing the following:
> boxfuse logs myapp -env=prod -logs.tail -logs.filter.instance=i-607b5ddcAnd if you aren’t quite sure what you are looking for you can also simply filter by time. For example to show all the logs created in the last minute (60 seconds) you could do:
> boxfuse logs myapp -env=prod -logs.tail -logs.filter.start=-60source: https://cloudcaptain.sh/blog/logback-log4j2-appender